The Complete Beginner’s Guide to Using Custom Thinkscripts
This tutorial will show you how to add custom Thinkscripts to your Think Desktop software. These instructions will walk you through how to set up any of the custom scripts I have published on my Google Site.
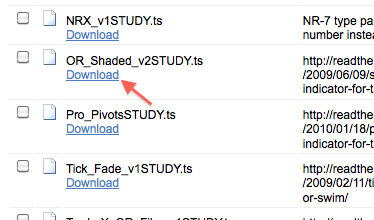
First, you download the file that you want to install:
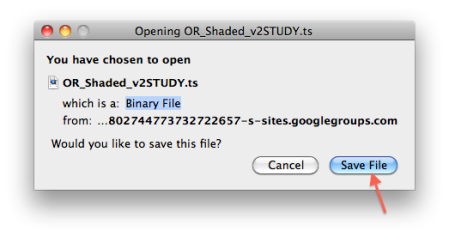
Save it somewhere on your computer that you can remember to get to later:
If the file has a “.ts” file extension, then you are ready to import it and can skip to the next step. If it’s a “.zip”, then you need to extract it first. If you are on Windows, use WinZip. On a Mac, the built-in archive utility can’t extract password-protected “.zip” files. But Stuffit Expander (free download from Apple.com) can. When you extract the files, enter the donor password if required, then extract the “.ts” file somewhere you can remember to go find it.
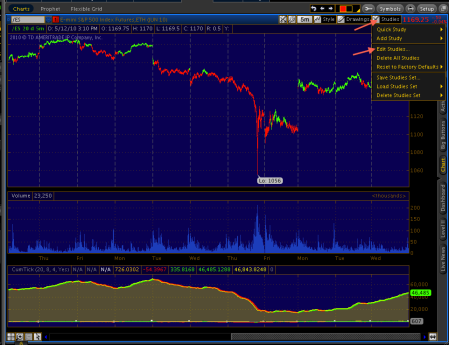
Next, open Think Desktop, go to a chart, click on “Studies” and choose “Edit Studies”:
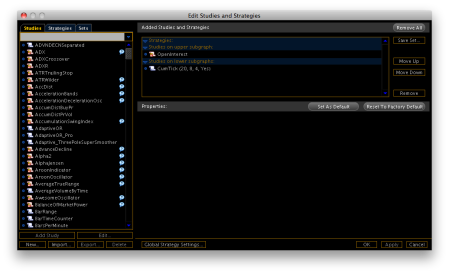
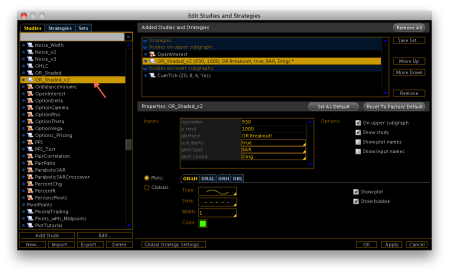
This brings up the “Edit Studies and Strategies” window. In the left pane is a list of all studies and strategies that are available for you to add to a chart. In the top pane there are the studies and strategies that are applied to the current chart, and the lower panel shows the parameters and settings you can change:
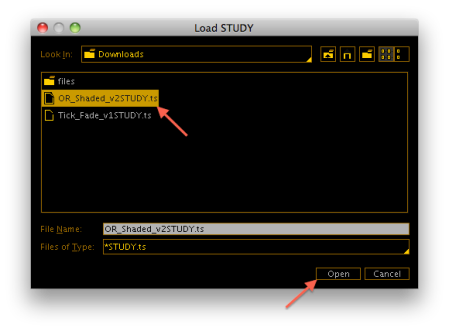
If you are importing a study, click the “Studies” tab in the upper left. If a strategy, then click the “Strategies” tab. Then to add the script you downloaded, click the “Import” button in the lower left corner. Browse to your file, and then click “Open”:
The file will be imported into your collection of studies. Now at any time you can scroll to it in your list and double click it to add it to any chart:
To see or modify the source code for any of the scripts, click the little parchment scroll icon next to its name.
And that’s it! You’re working with your scripts.

May 12, 2010 at 11:05 pm
[…] https://readtheprospectus.wordpress.com/the-complete-beginners-guide-to-using-custom-thinkscripts/ […]
May 14, 2010 at 4:10 am
[…] https://readtheprospectus.wordpress.com/the-complete-beginners-guide-to-using-custom-thinkscripts/ […]
June 29, 2010 at 8:59 am
Hello;
I am reading for a while your wrtting here and I wonder if you can help write a code for me,I am not a programmer I tried to write no lack up till now. Please let me know what are your rate or maybe you have a better Idea for me.
for example : I am trying to plot some signals using “Woodie CCI” for entry and exit
I can enclosed the code ,it is mainly cut and paste/
Hope to here from you soon
Thanks Reuven
June 29, 2010 at 9:36 am
I’ll send you an email
July 8, 2010 at 12:37 pm
Looking for help in altering the zig zag indicator so it would show labels on swings such as number of bars and and length of move. Is this possible? If so I would be happy to donate.
Thank you
July 27, 2010 at 11:39 pm
hi i want the range bar indicator for mt4 .please contact me
September 2, 2010 at 4:56 pm
Hi, I am looking for thinkscript programmers and also someone to help me develop strategies for TOS Prodigio. Do you know anyone available for hire?
Thanks again for your time,
Michael
September 2, 2010 at 5:07 pm
That would be me. Email me: readtheprospectus at gmail. I’m booked for the next two weeks though.
December 7, 2010 at 11:37 pm
Hi, I want to download weekly and monthly open/high/low/close data directly into Excel. How can I program or use your DDE programming to accomplish this for 1, 2, 3, etc weeks/months ago?
December 12, 2010 at 12:30 am
I wonder if you can help write a code for me. I’m interested in placing an alert / order based on a trendline break (oto with a trailing stop which of course is oco). The trailing stop would be a SMA + either a ATR volatility or Lookup as a confirming stop for exits. Please let me know what your rate is.
Thanks for your site,
Greg
January 12, 2011 at 10:48 pm
im new at this, im looking for a way to scan for stocks by using CCI .
can u help?
January 12, 2011 at 11:13 pm
Using CCI how?
January 17, 2011 at 2:27 am
Hi,
I have seen this request from people, but I have never seen the answer. I am trying to create a column on my watchlist that shows the current days volume as a percentage compared to the same time for the last 50 days. If the current days volume is higher than the average for the same time in days prior, then it would indicate the percentage above. If the percentage is below, then it would indicate the percentage below as a negative.
I was able to write a thinkscript that compares the current days volume to a 50 day average. It works well, but the numbers don’t have any reference to compare until the day is over.
Let me know how much you charge. I am new to thinkscript and would really appreciate any help.
Thanks,
Jack
January 17, 2011 at 5:50 pm
Hi, I was wondering anyone has or could build a trendline alert for TOS? I would want it to give an audiable alert anytime the trned line is broken, I would like to use it across all time frames if possible, Thx
April 19, 2011 at 10:30 am
Hi, I’m wanting to develop a simple RSI formula that can email me alerts when they happen. I reside in south africa I trade futures using the http://www.gt247.com ( global trader ) platform. I use netdania charts
Can you help
Regards
Domenic
27713019762
July 30, 2011 at 2:40 am
Hello,
I was searching for more info about thinkscripting and found your blog. I applause what you are doing, thanks.
Just a quick question from my side because I haven’t found my answer yet. I’m looking to creating a custom watchlist column that displays the percentage change from the day’s open. Basically something like plot percentChange = (close/open -1 ) * 100.
1- That doesn’t seem like the right open price and last price.
2- It doesn’t seem to update in real time whenever the last price changes.
Any pointers would be greatly appreciated. Thanks.
August 5, 2011 at 4:35 pm
Use (last-open)/open*100. Close is the day’s close, last is the last price.
September 11, 2011 at 9:13 am
Just an update about the percent change from open. The “last ” variable doesn’t exist. What I did is the following, as a watchlist custom column:
def O = open(period=”DAY”);
plot percentChange = round((close/O – 1)*100, 2);
percentChange.DefineColor(“Positive”, Color.UPTICK);
percentChange.DefineColor(“Negative”, Color.DOWNTICK);
percentChange.AssignValueColor(if percentChange >= 0 then percentChange.color(“Positive”) else percentChange.color(“Negative”));
The same code can be used for a custom study.
Unfortunately, the updates in the watchlist are a bit laggy compared to the study itself but it works quite well.
Permatrader
September 12, 2011 at 9:31 pm
I have just downloaded the # Prospectus study named
# CumTickv2STUDY
I was wondering if there is somewhere I can go to get an explanation for using this study?
If not, will you explain it?
September 12, 2011 at 9:37 pm
See here: https://readtheprospectus.wordpress.com/2010/10/25/cumulative-tick-study-v2-for-think-or-swim/
November 16, 2011 at 4:21 pm
hi! i like your work with TOS’s thinkscript. Would you happen to know the script for getting the bar number or exact time corresponding to the highest high/low on a 1 min Today chart? i’m trying to make a simple indicator that would in real-time show the time of day’s high/low or at least showing the number of bars that had elapsed from the day’s high/low to the current bar number. thank you.
December 7, 2011 at 11:35 am
Hi, I am not a programmer and would get some huge benefit from a particular function that I *think* thinkScript can execute. I was wondering if you’d be interested in helping me. I want something pretty simple – a watchlist of 100 or so stocks to give a notice when they are “inside” (low is greater than or equal to previous low and high is less than or equal to previous high) on a 30 min aggregation period. That’s it. I would like to be able to view if the condition is true DURING the period, with another column showing the prior periods TRUE’s. I would be happy to explain further (or clarify anything that wasn’t very clear!) if you think you could provide me some help. Thanks in advance.
December 29, 2011 at 7:47 pm
Hi I like to implement your tick study, but TOS gives me this info.
“Invalid statement: def at 12:1
No such variable: range at 13:15
calcValue: missing parameter”
Any ideas on how to fix it? Thanks!
p.s. don’t give up on your trading. trade the market not single stocks. don’t fight the market and create a plan. congrats on the child. best investment of all. best wishes.
May 15, 2012 at 10:01 pm
I’m running TOS DDE TEMPLATE and it does not handle options tickers.
May 25, 2012 at 12:16 pm
I’ll look into it
July 26, 2012 at 10:25 am
Hi, I just came across your website-do you have code that will automatically make a trade for you based on specific stocks passing technical indicators and fundamental indicators that can be specified? If so, which file is a sample of this kind of code?
July 26, 2012 at 11:20 am
No, I’m afraid I don’t.
November 12, 2012 at 3:27 pm
Hi
You are doing a great job in scripting. Appreciate that you are sharing your knowledge. I have a quick question on TOS scripting.
Here is the part of my code.
def signal = If(IsNaN(HBar), 0,
If(spike = HBar, 1, 0)));
Plot myhigh = if (signal == 1, high, 0);
Plot mylow = if (signal == 1, low, 0);
I am trying to get the High and Low of the signal bar. Unfortunately, due to tos scripting, it is overwriting the values. Is there anyway, we can just get the high and low of the signal bar without overwriting when we pass through the following non-signal bars.
Thanks in advance.
November 12, 2012 at 4:03 pm
Yes, you use rec statements like this:
Rec myhigh= if signal==1 then high else myhigh[1]; Rec mylow= if signal==1 then low else mylow[1];
On Nov 12, 2012, at 2:27 PM, Read the Prospectus
November 16, 2013 at 3:45 am
Any help? I have the below working. Not I want to be able to alert (I got the alert part although it is not here) when the price or close price of the last bar or agg period is within alertprice. Any help?
input aggregationPeriod = AggregationPeriod.DAY;
input length = 1;
input displace = -1;
input showOnlyLastPeriod = no;
input alertprice = .05;
plot PrevDayClose;
if showOnlyLastPeriod and !IsNaN(close(period = aggregationPeriod)[-1]) {
PrevDayClose = Double.NaN;
} else {
PrevDayClose = Highest(close(period = aggregationPeriod)[-displace], length);
}
;
November 16, 2013 at 3:31 pm
I’m not sure what you’re asking for?
December 5, 2013 at 12:51 am
Perhaps you might be able to help with this. I’ve been trying to write ‘some’ code, some being the operative word there but i’m not having any luck. This is what i was trying to accomplish for a scan of the market… FLOAT<30000000 and RSI20 Again, this is just a simple scan for the market. Any help on this matter would be appreciated.
December 5, 2013 at 12:53 am
Sorry for the 2nd post but apparently that RSI didn’t come out correctly. RSI is less than 50 and RSI is greater than 20.
December 16, 2013 at 4:57 pm
I’ll look at it
December 17, 2013 at 11:00 am
could you send an e-mail please hard to explain what i need
December 17, 2013 at 11:20 am
in addition what i have is proprietary
March 1, 2014 at 2:44 am
Looking for 1 and 2 standard Deviation lines or labels based on current price..
May 8, 2014 at 12:44 pm
Can you do the Mansfield Relative Strength that Stan Weinstein referred to in his book? A link to a free online charting service that uses it is:
http://chartmill.com/documentation.php?a=398&title=Relative%20Strength%20%28Mansfield%29
What are your rates?
Thanks,
Bon
June 3, 2014 at 8:01 am
Hi there
Can you help with custom coding for an indicator on TOS?
If so please email me and I will provide the details of what I want.
Regards
Richard
June 16, 2014 at 7:13 pm
Hi there
if you need help with thinkscript please email me: toslancer [at] gmail.com
June 23, 2014 at 8:47 am
hello sir, i have seen all your pages. let me introduce myself i am from india doing trades in nse exchanges and mcx exchangs following mt4 charts. but here you have given screen shots in some other method.. i am not have much knowledge to do all this download apply method and all… if you guide me i will do all things.. your methods are really superb sir. i want to get some profits out of trades sir because every time i am failing. guide me please .. to put any indicator for good successful trades
thanking you
ramzamma
December 2, 2014 at 10:15 am
I track three factors of Keltner Channels (1,2, & 3) and want to scan for stocks whose candelsticks are more than 3 Keltner Channels out of norm. This is kind of a “reversion-to-mean” strategy. Do you have such a script or help me make one?
March 28, 2015 at 7:29 pm
I have a simple question, using “input” in declaring a max and min value for use in cystom stockhacker studies for scans doesn’t seem to work. Am I doing something wrong, is it supposed to work? Also I can’t seem to name my custom studies in the scanning tool. They are all defaulted to customs
Thanks for any info
March 28, 2015 at 7:43 pm
Email me your code and I’ll look: readtheprospectus at gmail
January 22, 2016 at 4:27 pm
could you email me? i would like to send you some code to look at. need your help.
February 16, 2016 at 8:06 am
What your e -mail address where to throw confirmation of donation?
May 28, 2016 at 9:08 am
I need an indicator programmed in think script. The indicator is currently coded for Metatrader 4.
February 11, 2018 at 4:30 pm
Thank you for the scipts.Can you help identify a script with and EMA crossover of say 8 and with increasing volume ?
March 20, 2018 at 7:59 am
Hi, i’m part of a signals group and wanted to code some custom indicators for myself and learn tos scripts. Here is a link with videos to give you an idea of what i’m looking for: https://www.youtube.com/user/binaryoptiontrader/videos.
Do you have any sample code to get me started with, especially the pink/yellow/red arrow indicators. Thank you
March 20, 2018 at 10:58 am
Email me readtheprospectus at gmail
>
June 10, 2018 at 2:55 pm
Can we the contents of the Guide? I will be happy to donate. Thanks
June 10, 2018 at 2:56 pm
Can we see the contents of the Think Script Beginner’s guide?
June 10, 2018 at 4:34 pm
This post is it! I didn’t mean it was a complete guide, it was a quick start for complete beginners. It wasn’t worded well.
I should put together an actual guide though.
>
September 18, 2019 at 1:18 am
Have you updated MACrossover_w_AlertsSTUDY.ts I’ve tried unsuccessfully to create a moving avg crossover scan using a three hour period but think or swim will not allow me to use that period in scan because it is not default period. I could use the four hr. period but I don’t know thinkscript well enough to write my own. I have used different inputs that seem to give good signals using the 5/9 EMA or other similar timeframes which show great promise, but I cannot generate a result that identifies the exact day/time that it occurs and is many days later. I’d be more than happy to donate/follow if you have this scan. Please contract me at shrkpruf@yahoo.com Thanks in advance for your time and consideration,
December 7, 2019 at 2:31 pm
for thinkorswim:
Does anyone know how to plot current book value per share of a particular stock on a chart? These is a defined function BookValuePerShare but i can’t figure out how to plot it.
For example the book value for JPM is currently $70, how do i plot a horizontal line at price point 70 on the chart? Thank you.
June 14, 2020 at 2:25 pm
@Michael F I know someone available for hire.
June 14, 2020 at 2:27 pm
It’s a colleague of mine by the way.
August 1, 2022 at 10:27 am
Do you do programing for hire?
I would like a ThinkScript script that will send me a notification when the HeikenAshi Candle changes direction from Red to Green and from Green to Red.
Is this something you can write?