Posts Tagged ‘divergence’

A Look at a Few Charts Right Now

July 17, 2019

Going into August is the time I have historically lost the most in my trades. I overtrade and try to push something through when the markets are in a choppy, listless environment. So one of my rules is that I don’t trade from the end of July through Labor Day.

That said, here’s a few daily charts I’ve been watching and what I think my indicators are telling me. I’m mainly looking at the ProSwingVWAP and the Multi-Divergence Indicator v2 on the RSI(20). Also plotted in a gray line is an indicator I’m working on called AdaptiveSuperSmoother. I prefer it over moving averages. More on that later. On to the charts:

$SPY (S&P 500 ETF)

The broad market. As far as divergence, there isn’t any. No hint of weakness on a longer timeframe. The lower Swing VWAP is far below, so no definitive trend change. Since the middle of June we’ve broken the upper Swing VWAP 6 times. Today’s weakness doesn’t look good for continuing that streak, however. This looks like a textbook chart for sideways chop. This tells me take August off.

$AAPL (Apple Computer, Inc)

I am always and everywhere a big Apple fan. Slightest of slight bearish divergence. Nothing compared to what we saw at the end of April. I’d ignore that here. The upper Swing VWAP points are barely grinding higher, so no real bullish drive. Not near the recent high in May. The lower Swing VWAP is well below the current price, so no likely trend reversal indicated yet. All signs point to blowing up your account overtrading it in August.

$ROKU (Roku Inc.)

Roku has been a monster all year. Into June, a large bearish divergence showed up as it pushed above $100. We got a 10% drop after that, and the divergence ended. In the first part of July there was an upper Swing VWAP breakout at about $95. I most recently went long there at $97. Pushed back up to new highs where we are now. The drop today seems like a rejection of that newest high. The lower Swing VWAP is down at $100. Below $100 I’d look for a trend change to bearish. It would take strength above $114 to look like a continued uptrend. Another sideways chart, though I see more of a downside risk here. I’m still long here but wouldn’t add at this time, and will watch $100 closely.

$TSLA (Tesla Motors, Inc.)

Tesla is interesting here. A bullish divergence back in early June signaled a potential trend change upward. Tesla demolished upper Swing VWAP’s from that point onward. The lower Swing VWAP from that big reversal has still not been tested. Strong uptrend. The latest weakness today after another upper break doesn’t inspire confidence, and we are far from the Adaptive Super Smoother “average” price. Kind of extended. It looks like Tesla’s bull trend is still intact, but this isn’t the time to get on board, especially with the broad market likely to languish for a while. The upside target would likely be about $290 resistance from the April highs, but I wouldn’t expect that to happen until the fall. With earnings coming up between now and then, it’s a wait-and-see chart here.

So it’s a whole lot of nothing out there. Sit on your hands or play with Bitcoin pinless hand grenades. Crypto is making biotech names seem like investment grade. With the yield curve inverting and possible recession looming, the end of the year should be interesting.

Example Swing VWAP / RSI Divergence Trade: $AAPL

February 8, 2019

Here’s a trade I entered in Apple about 2 weeks ago where I used the Swing VWAP and the RSI MultiDivergence indicators.

Back in January, the market had gone through a good decline. I was watching the RSI divergence on AAPL. Around that time, a big divergence showed up. This was about the largest in the last two years, and is circled on the chart below. Because of that context, I wanted to look for a long entry. After the swing low on January 3, AAPL kept above the Swing VWAP. It pulled back close to the Swing VWAP, and then on January 15 it had a bullish reversal candle (white arrow). That means the bears are losing, since it couldn’t penetrate the lower VWAP. I entered at the end of the day (yellow line) with a stop at the prior day’s low Swing VWAP (red line), and a target at $185 based on prior resistance.

So far, the trade is going according to plan. My stop is at $160 now, and I just have to manage when I take profits–at the predetermined target or in a discretionary manner. I’m really liking the Swing VWAP for how it tracks what side is winning and what side is losing. As a trader, your money comes from the losers. Markets move because they have to, and that happens because people are blown out of their incorrect positions.

Example Divergence Trade: Netflix (NASDAQ: NFLX)

October 23, 2017

Here’s a divergence trade I took last week in $NFLX, using the Multi-Divergence indicator in my trade plan. 

The setup: NFLX announced earnings on Oct 16.  Price made an all-time high.  I looked at the chart and saw a big divergence on the volume-weighted MACD.  The last big divergence in June led to a big drop. So I was looking to get in a bearish position. 

The candle on Oct 17 is the most recent bar on this chart. I saw that the bar had made the all time high and then fallen down below the prior day’s close, which I took as my bearish entry signal with NFLX at $200. 

The plan: $190 looked like a possible support, and a return to $204 would tell me my timing was wrong. I thought this move should happen in the next few days, so I bought the Nov 3 weekly options 197.5/195 put spread for $0.97.  I chose the 197.5 strike instead of the at-the-money 200 strike because it had higher gamma—it would have a larger change in delta with movement if I was right.  If the move didn’t come in the next day or so, I would get out and move on. 

I didn’t have to wait long:

The day ended red and had a good follow through day next. When the 190 support was nearly hit, I went to take profits. I sold for $1.57, which is a return of about 62%.  I love it when a plan comes together (extra Hannibal).

Note that the divergence indicator wasn’t the entry signal—it just provided context to give me an edge.  Divergences can often resolve with a continuation in the trend instead of a reversal. The context combined with the actual reversal behavior in the daily candles was what led me to take a trade. Always have a plan before you trade, and always follow your plan. My failures have come when I don’t do one or both of those things. 

Multi-Divergence Indicator for Think or Swim: MACD, RSI, CCI, On Balance Volume and many more

January 11, 2015

whatitlookslikenew

I figured out a way to combine all my divergence indicators into one single study. The new Multi-divergence script uses slopes of linear regression lines just like in the new MACD divergence indicator. This script supersedes all the other divergence scripts. The difference is now it can perform a regression on any one study of your choice from a list of ToS indicators. The indicators currently supported for divergence analysis are:

MACD, RSI, CCI, Momentum, Moneyflow, On Balance Volume, Rate of Change, Stochastic Momentum Index, Ultimate Oscillator, Volume Flow Indicator, Volume Oscillator, Volume Rate of Change, Volume-Weighted MACD, Williams Percent-R, and Woodie’s CCI

(Note that it doesn’t scan all of these for divergence at once. Just the one indicator you select. If you want to have RSI and MACD at the same time for example, you put the script on your chart twice and select the appropriate indicator for each one separately.)

If there is another built-in ToS indicator you want to have available for divergence analysis, let me know and I can add it in future updates. You can use the Multi-divergence indicator on real time charts and in scans of watch lists, and I put in alert logic so it can ping you when a divergence occurs.

This indicator is for blog donors only.  You can find it on my google site under Released Thinkscript Studies down in the Donors Only section. If you already donated in the past you can use your password to access it. If you want to become a donor (or throw me some more coin) you can do so by clicking the Donate button:

As always, if you are a DIY’er, feel free to ask questions in the comments and I’ll help answer.

UPDATE: MACD Divergence Indicator for Think or Swim

December 10, 2014

This indicator has been updated!  See the new post here.

This has been a long time in coming.  My family life has been in upheaval for a couple years now.  I finally had a bit of time so I wanted to get this done.  Thanks for staying with me.

Many people have asked for a version of the MACD Divergence Indicator that can run in a scan.  The old one I had ran on recursive logic and so wasn’t supported in scans.  This new one uses a different philosophy that runs in real time.  Before I would use my Swing Points and check the value of the MACD against them.  Higher swing highs and lower corresponding values of MACD on those bars would signal a bearish divergence.  Now I am using Linear Regression slopes to compare divergences.  Here’s the theory of how it works:

A linear regression is a way to fit a straight line through some data such that you get the least amount of average distance from the line. If the slope of the linear regression is up, then values are generally trending upward over the set of data you put in. If the slope is negative, then the values trend downward.

So I take a linear regression of price, then get the slope of the LR, and I also take a linear regression of the standard MACD indicator and get that slope. When the price slope is positive and the MACD slope is negative, we have a bearish MACD divergence. If price slope is negative and MACD slope is positive, we have a bullish divergence. If price slope and MACD slope are the same, we have a trend continuation (up/up or down/down). This chart shows this theory in action:

howitworks


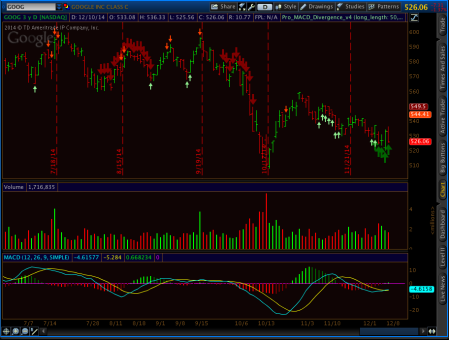
Here’s what my indicator actually looks like.  The small arrows are short term divergences, the larger arrows are the long term divergences.  The short and long timeframes are inputs, so you can set them at whatever you want.  This chart uses 20 and 50 as the inputs, but you can experiment with what works best for what you are trading:

whatitlookslikenew

As with all divergences, just because it is there doesn’t mean that the trend must reverse. Sometimes divergences can go on for a long time. This information is good to give you a sense that a trend might reverse, and you can plan your own entry and stop accordingly.

Now, to set set up a custom scan, you follow the instructions in these pictures:

scan1

scan2

Then when your scan runs, you will get flagged if the divergence you asked for is currently found.

This indicator is for blog donors only.  You can find it on my google site under Released Thinkscript Studies down in the Donors Only section.