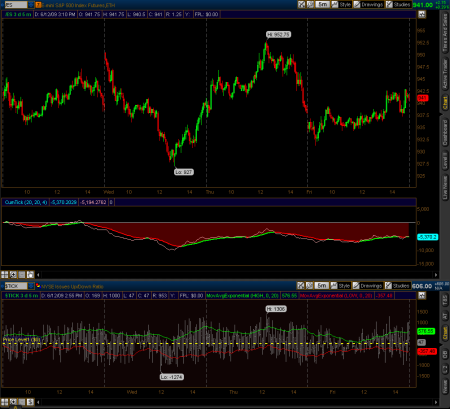
After a comment by Donahchoo on Twitter, I started thinking of ways of looking at cumulative values of the NYSE Tick.
As with many other topics, there has been exhaustive treatment of what the Tick is and the significance thereof. Richard at Move the Markets has a very good Tick article if you want this background info. Dr. Brett Steenbarger talks a lot about how he uses cumulative adjusted Tick; see his blog for more details on what he does with it. Building on this foundation of what the Tick is, I’ll jump right in. This is more of a thought journal of my impressions than an exhaustive treatment of an optimized indicator, so it’s a bit rough around the edges.
I’ve been thinking that the most revealing information comes when we see extremes in the value of the Tick. Many times we hear of the tick being referenced to absolute levels: above +1000 could mean heavy buying, below -1000 heavy selling. The trouble with this is that sometimes you get a spike in the Tick that is unsustainable (and you should fade it), and sometimes you get heavy, extended readings for a long time (that you should be following). But the absolute level of the Tick doesn’t really tell me which is which. Additionally, it seems that when the low of a bar of the Tick stays relatively high (such as the low of a 5 min Tick bar being at +400 and the high at +1200), that means more for strength than having both a high and a low reading in the same bar, as in both +1200 and -1200.
So to define an extreme, I decided to use a different approach. First, I apply two exponential moving averages to create bands. I plotted the EMA(20) of the highs in the Tick, and the EMA(20) of the lows. Then I wrote a script to sum the net extremes ONLY, ignoring any Tick readings happening inside the bands, using this formula:
def htick = high("$TICK");

def ltick = low("$TICK");

def avgh = expaverage(htick,20);

def avgl = expaverage(ltick,20);

def bull = if htick > avgh then htick - avgh else 0;

def bear = if ltick < avgl then ltick - avgl else 0;
rec ctick = if barnumber()==1 then 0 else if IsNaN(htick) OR IsNaN(ltick) then ctick[1] else ctick[1] + bull + bear;
That code will sum only the extreme Tick readings, as defined by our EMA bands. I like this because it forms an adaptive definition for tick extremes, and it also captures the effect of having high Tick highs and lows as I described above, and vice versa for low highs and lows.
I wrote a full indicator to test this out on a 5min chart of the last 3 days in ES. I’ve plotted the indicator below the price chart. I’ve also included a separate plot of the Tick for visualization purposes. The CumTick indicator is doing all it’s own calculations behind the scenes. There are three things going on that I’ll explain:
1. A net sum line (thin line) for the cumulative values of ctick as described in the code above.
2. A 20 period EMA of the net sum line. This is done for smoothing purposes. This line is colored according to values in it’s own past–if the EMA is above the value of the same EMA 4 periods ago, it is green, else red. This lookback is kind of like the way the Fisher transform looks back at it’s own past values, only it uses a lookback period of 1.
3. I have added a cloud, red if the EMA is below zero, and green if it is above zero.

You can see that the red/green EMA does pretty well on choosing the dominant market direction. Zooming in for some detail, I’ve annotated graphically what my code from above is doing:

I wrote a couple of strategies to run a quick backtest on this. I went long when the EMA went from red to green, and opposite for shorts. I also included an ‘exit on close’ to keep this to a daytrading strategy only. Here’s what the trades looked like:

Only a couple of whipsaws, but the entries had some significant retracement at times. With no stop loss or profit target, just reversing according to color and going flat at the end of the day, here’s the results (in ES points) for the 3 day period:
Max trade P/L: 10.00
Total P/L 26.25
Total 41 order(s)
That’s very encouraging! I always want to do a sanity check on new ideas. If it’s not profitable in a simple test, you’re not going to mine gold by tweaking it. I would need to do more work in looking at stops and more backwards data to gain confidence in it, and work on an entry setup to see if there was a smarter way to get in. I welcome comments and any ideas anybody may have, if you’re interested. You can download my indicator file and the strategy files (look for “Cumulative Tick.zip”) in the “Work in Progress” section at my google site.


