Posts Tagged ‘macd’

Multi-Divergence Indicator for Think or Swim: MACD, RSI, CCI, On Balance Volume and many more

January 11, 2015

whatitlookslikenew

I figured out a way to combine all my divergence indicators into one single study. The new Multi-divergence script uses slopes of linear regression lines just like in the new MACD divergence indicator. This script supersedes all the other divergence scripts. The difference is now it can perform a regression on any one study of your choice from a list of ToS indicators. The indicators currently supported for divergence analysis are:

MACD, RSI, CCI, Momentum, Moneyflow, On Balance Volume, Rate of Change, Stochastic Momentum Index, Ultimate Oscillator, Volume Flow Indicator, Volume Oscillator, Volume Rate of Change, Volume-Weighted MACD, Williams Percent-R, and Woodie’s CCI

(Note that it doesn’t scan all of these for divergence at once. Just the one indicator you select. If you want to have RSI and MACD at the same time for example, you put the script on your chart twice and select the appropriate indicator for each one separately.)

If there is another built-in ToS indicator you want to have available for divergence analysis, let me know and I can add it in future updates. You can use the Multi-divergence indicator on real time charts and in scans of watch lists, and I put in alert logic so it can ping you when a divergence occurs.

This indicator is for blog donors only.  You can find it on my google site under Released Thinkscript Studies down in the Donors Only section. If you already donated in the past you can use your password to access it. If you want to become a donor (or throw me some more coin) you can do so by clicking the Donate button:

As always, if you are a DIY’er, feel free to ask questions in the comments and I’ll help answer.

UPDATE: MACD Divergence Indicator for Think or Swim

December 10, 2014

This indicator has been updated!  See the new post here.

This has been a long time in coming.  My family life has been in upheaval for a couple years now.  I finally had a bit of time so I wanted to get this done.  Thanks for staying with me.

Many people have asked for a version of the MACD Divergence Indicator that can run in a scan.  The old one I had ran on recursive logic and so wasn’t supported in scans.  This new one uses a different philosophy that runs in real time.  Before I would use my Swing Points and check the value of the MACD against them.  Higher swing highs and lower corresponding values of MACD on those bars would signal a bearish divergence.  Now I am using Linear Regression slopes to compare divergences.  Here’s the theory of how it works:

A linear regression is a way to fit a straight line through some data such that you get the least amount of average distance from the line. If the slope of the linear regression is up, then values are generally trending upward over the set of data you put in. If the slope is negative, then the values trend downward.

So I take a linear regression of price, then get the slope of the LR, and I also take a linear regression of the standard MACD indicator and get that slope. When the price slope is positive and the MACD slope is negative, we have a bearish MACD divergence. If price slope is negative and MACD slope is positive, we have a bullish divergence. If price slope and MACD slope are the same, we have a trend continuation (up/up or down/down). This chart shows this theory in action:

howitworks


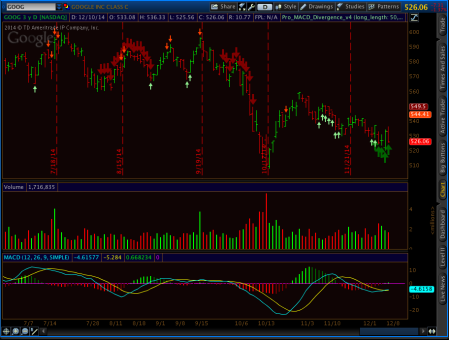
Here’s what my indicator actually looks like.  The small arrows are short term divergences, the larger arrows are the long term divergences.  The short and long timeframes are inputs, so you can set them at whatever you want.  This chart uses 20 and 50 as the inputs, but you can experiment with what works best for what you are trading:

whatitlookslikenew

As with all divergences, just because it is there doesn’t mean that the trend must reverse. Sometimes divergences can go on for a long time. This information is good to give you a sense that a trend might reverse, and you can plan your own entry and stop accordingly.

Now, to set set up a custom scan, you follow the instructions in these pictures:

scan1

scan2

Then when your scan runs, you will get flagged if the divergence you asked for is currently found.

This indicator is for blog donors only.  You can find it on my google site under Released Thinkscript Studies down in the Donors Only section.

Alternate Symbol MACD Indicator for Think or Swim

September 21, 2010

I’ve been so busy, gotten sick, had work deadlines, that I’ve been away from the blog for ages. I’m making a renewed push at all my projects, so here’s an indicator that was requested by a reader: A MACD that follows an symbol independent of the symbol of the underlying chart. You could use this to plot the MACD of the VIX onto a chart of the VXX ETF for example. Or to plot the broad market SPY on an individual stock you are watching.

Anyway, here’s how to do it:

A MACD is just a distance between two moving averages. The histogram is a distance between the MACD line and a moving average of that line. So we will build our own MACD from scratch using data from the symbol we are interested in.

Traditionally, the MACD uses exponential moving averages. I don’t know that it matters, but I do prefer exponential over simple because of the way they blend out past data. So we start with the inputs for the symbol and the MACD periods:

Input symbol=”VIX”;
Input period1=12;
input period2=26;
input periodhist=9;

Next we create the two exponential averages for the MACD line:

Def exp1=expaverage(close(symbol),period1);
Def exp2=expaverage(close(symbol),period2);
Plot MACD=exp1-exp2;
Def macdma=average(MACD,periodhist);
Plot Hist=MACD-macdma;

Add some formatting and that’s it!

This indicator is free. You can download “AltMACDSTUDY.ts” from “Released Thinkscript Studies” on my Google site. Thanks for (hopefully still) reading!

MACD Divergence Indicator for Think or Swim

May 6, 2009

This indicator has been updated!  See the new post here.

Following on the heels of my Swing Points indicator, I wrote an indicator that looks for divergences between the MACD and price. Every time we get a lower swing low, the MACD is checked to see if it also prints a lower low. Similar for highs; higher high without higher MACD is a divergence. Here are two pictures of the indicator at work. I have my Pro SwingPoints plotted in gray, and the ProMACDDivergence plotted as a red dot for bearish divergence, and a green dot for bullish divergence

First, a 5min chart of ES:

macddivergencesignals

And next a daily chart of ES:

macddivergencesignals_daily

This is not really a strategy I am interested in personally, but many people use MACD as a part of their trading system. So, I won’t go into the theory of how to use it or sing its praises here. There are plenty of sites out there with that info. I’ll talk about the construction of the indicator so you can “try this at home”.

As I said before, you could define your swing points as follows:

Def swinghigh = if high > high[1] and high > high[2] and high > high[-1] and high > high[-2] then 1 else 0;

and

Def swinglow = if low < low[1] and low< low[2] and low < low[-1] and low < low[-2] then 1 else 0;

If you want x more bars to define the swing points, you add more high > high[x] and low < low[x] checks.

Next, you use the “reference” Thinkscript command to access the built-in code for the MACD indicator. To use reference, simply type “reference” and the name of the built-in study you want to access, followed by a “.” and the name of the output parameter you want to get. For this example, I wanted MACD and “value” as my output, so I used “reference MACD.value”. To find all of the possible output parameters and how to call them, add the built-in study to any to a chart, and then look at the names of all of the outputs:

macdinputs

You can also specify both inputs and outputs, such as “reference MACD(macdlength=5).diff”, which would change the period of the moving average of MACD from the default of 9 to 5, and return the histogram value. If you don’t include an input in a reference call, Thinkscript will just use the default value.

Meanwhile, back at the ranch, I wrote two recursive functions to check for and track the value of MACD at each swing point:

rec blMACD = if swinglow then reference MACD.value else blMACD[1];
rec brMACD = if swinghigh then reference MACD.value else brMACD[1];

This code will check if the current bar is a swing point according to your definition, and if so, it returns the value of the MACD there. If it is not a swing point, it just rolls the prior swing point MACD value forward. I also wrote similar functions to track the prior value for swing lows and swing highs using the same type of logic. The final task is to check at each swing low to see if it is lower than the previous swing low, but has a higher value of MACD for bullish divergence, and vice versa for bearish divergence, i.e. higher swing high, lower MACD value. If the check for divergence is true, I plot the respective low/high of the swing point bar, colored red for bearish and green for bullish.

This should be enough info for you to write a study of your own if you want. Feel free to ask questions if you need any help; I’m always glad to teach people who want to learn! Alternatively, if you “gotta have it now”, you can get it as “Jackson-ware”. Donate $20 and I’ll email the script out to you. If you donate, be sure to email me and let me know what you donated for so I can send it to you! The Pro MACDDivergence indicator has all the source code I used, including the generalized method to change the number of bars used to identify swing points as a simple input.