Here’s the v2 for my cumulative tick study. See the prior post for the full explanation of what it is doing and why.
Changes:
I include the trend correction automatically. I took the paintbars out. The “ema” input is now called “smooth” for clarification.
New inputs:
“Filter”–for the high and low bands, you can filter on a minimum tick level such that the bands don’t overweight small adverse tick values after a pronouced move. Basically, if you think +-300 on the NYSE tick is “noise”, then enter 300.
“Symbol”–you can use any symbol you want: $TICK, $TICKQ, $TIKI or anything else.
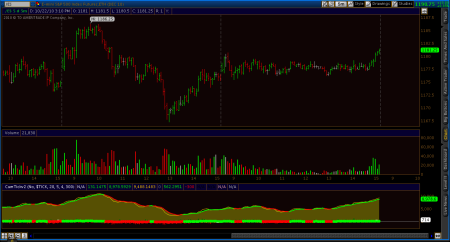
You can also hide the cumulative tick plot or show it. If you show it, you get a plot that looks like this:
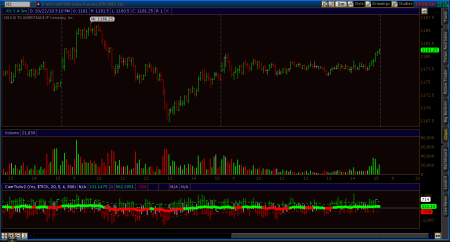
If you hide it (default) then you get a chart like this, where you can see the detail of each tick reading:
The color of the dots shows you the color of the cumulative tick, just the same as if you were showing the cumtick plot. Usually, we don’t care about the absolute value anyway, just the trend of it, so this is default. The values of the dots are the values of the trend correction that is being added into the cumulative tick number. Confusing? I hope not, but leave a comment if so.
I did some cleanup to the indicator, so the tick bars now plot the actual high and low values like a regular price-based bar, not just a flat out histogram from 0 to the value. Basically, you’ll see some black gaps if the low of the tick was positive, or the high of the tick was negative. Just aesthetics. If your chart background is not black, then change the colors of the “hib” and “lob” plots to match your background.
Finally, there is a little white dash on the most recent bar showing the “last” value of the tick, so you can see in real time where its printing. After the fact it just shows the closing value at the last bar of the day.
This version is free. Download “CumTickv2STUDY.ts” from my Google site under “Released Thinkscript Studies“.
Tags: cumulative tick, Thinkscript


November 17, 2010 at 4:01 pm
[…] latest update broke the ability to hide clouds automatically. So I fixed it in the CumTickv2 study. The version on my Google site is the most recent one. Go download again if you want […]
July 22, 2013 at 9:02 am
I have been using your CUMTICKV2 indicator for some time now and I certainly appreciate it’s usefulness. But today in TOS it does not appear to be providing the same information. It appears there have been some changes but I am unaware of how to correct the formulas to take into consideration any changes in the data provided. Any comments would be appreciated. Thank you,
Steve Hopkins
July 24, 2013 at 9:23 am
I’ll take a look at it
July 25, 2013 at 8:00 am
When I plot a chart of a stock like $AAPL, it looks fine to me. When I plot /ES it goes all funny after the first day on the chart. I’m trying to figure out why.
July 25, 2013 at 9:16 pm
I am sorry I was not specific during my first response. I trade the e-mini futures. Using TOS on the day’s specific chart it seems to work fine (3m price chart), now (at least today it did). It did not on Monday. But it I use a two day chart, then the cumulative value is not calculated and this chart looks like a $TICK indicator chart. I am not a programmer but it appears to me that with the latest TOS upgrade a portion of the data is not being supplied to this formula. Thanks in advance for any insights you can provide.
Steve Hopkins
shopkins1330@yahoo.com
August 1, 2013 at 8:23 pm
A follow up to our previous correspondence. A response from TD Ameritrade is as follows, I don’t know if this helps but I wanted to pass it along.
FromthinkScript@thinkorswim.com
Toshopkins1330@yahoo.com
thinkScript@thinkorswim.com
Steve,
I guess I would first ask about what type of products you view with this script. If it a product, like a futures contact that trades beyond the scope of the $TICK, then this is producing errors due to a substitution issue that the chart system is having. Even if the code is working at a time $Tick does not, it can substitute the value with something stored from earlier. However, it doesn’t seem to work right now. I know this is one of our biggest issues from the release. I have already reported it and believe that is the cause of this script’s issue. If you think it’s anything else, let me know and I’ll look further.
Thanks,
Charles Tauchman
Trade Desk
Description: Description: cid:image003.gif@01CD3E6D.68632DA0
TD Ameritrade and thinkorswim do not offer script writing services at this time, however, on a request basis we may provide educational examples to assist in your assimilation of our proprietary programming language. All thinkscript support is by email only. We recommend that you review and study the thinkScript manual prior to utilizing any custom script.
Thinkscript Manual — http://tda.thinkorswim.com/manual/dark/thinkscript/index.html
This message is confidential and sent by TD Ameritrade solely for use by the intended recipient. If you are not the intended recipient, you are hereby notified that any use, distribution or copying of this communication is strictly prohibited. If you have received this electronic transmission in error, please notify us by telephone at 800-669-3900 immediately. This should not be deemed as an offer or solicitation, to buy or sell any product. Any 3rd party information contained herein was prepared by sources deemed reliable, but is not guaranteed. TD Ameritrade does not accept electronic instructions that would require an original signature. Information received by or sent from TD Ameritrade is stored, subject to review, and may be produced to regulatory authorities or others with a legal right to such.
November 23, 2016 at 7:59 am
Any way to get this indicator to work with individual stocks, using their tick/time and sales feed?
January 12, 2017 at 7:33 pm
thank you for this site god bless.
January 20, 2017 at 9:20 am
Thanks, been looking for something like this.
One thing that would be helpful is a reset to zero every day so you can use it on a multiple day chart.