Posts Tagged ‘cci’

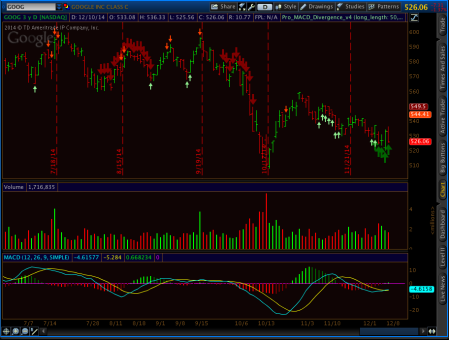
Multi-Divergence Indicator for Think or Swim: MACD, RSI, CCI, On Balance Volume and many more

January 11, 2015

whatitlookslikenew

I figured out a way to combine all my divergence indicators into one single study. The new Multi-divergence script uses slopes of linear regression lines just like in the new MACD divergence indicator. This script supersedes all the other divergence scripts. The difference is now it can perform a regression on any one study of your choice from a list of ToS indicators. The indicators currently supported for divergence analysis are:

MACD, RSI, CCI, Momentum, Moneyflow, On Balance Volume, Rate of Change, Stochastic Momentum Index, Ultimate Oscillator, Volume Flow Indicator, Volume Oscillator, Volume Rate of Change, Volume-Weighted MACD, Williams Percent-R, and Woodie’s CCI

(Note that it doesn’t scan all of these for divergence at once. Just the one indicator you select. If you want to have RSI and MACD at the same time for example, you put the script on your chart twice and select the appropriate indicator for each one separately.)

If there is another built-in ToS indicator you want to have available for divergence analysis, let me know and I can add it in future updates. You can use the Multi-divergence indicator on real time charts and in scans of watch lists, and I put in alert logic so it can ping you when a divergence occurs.

This indicator is for blog donors only.  You can find it on my google site under Released Thinkscript Studies down in the Donors Only section. If you already donated in the past you can use your password to access it. If you want to become a donor (or throw me some more coin) you can do so by clicking the Donate button:

As always, if you are a DIY’er, feel free to ask questions in the comments and I’ll help answer.
CCI Divergence Indicator for Think or Swim

May 21, 2009

This indicator has been updated!  See the new post here.

I got commissioned to write more divergence indicators, and the customer was generous enough to allow me to share it with the rest of the donors. I say donors because it builds on my donor-only fully variable swing points indicator, so I’m not releasing it freely as a sponsored indicator. If you are a past (or future 🙂 ) donor, you can get it from the “Released Thinkscript Studies” page, called “Pro_CCIDivergence_v1STUDY.zip”. I like this “donor share” idea and will keep doing it as those who commission custom work are willing to share. If you don’t care to donate or you just want to do-it-yourself, it’s not complicated to write your own if you already have a swing points logic built, like I outlined previously. I’ll walk through the additional steps below.

Following on the heels of my Swing Points and MACD Divergence indicators, here’s two more indicators that look for divergences between the CCI and price, and divergences between Price and CCI. There’s one upper study and one lower study.

Every time we get a lower swing low in price, the CCI is checked to see if it also prints a lower value. Similar for highs; higher high without higher CCI is a divergence. Here is a picture of the indicator at work. On the upper frame, the ProCCIDivergence is plotted as a red dot for bearish divergence, and a green dot for bullish divergence. On the lower frame, the opposite divergence is checked. If the CCI has a a lower swing low, the price lows are checked to see if they also print a lower value. Similar for highs; higher CCI swing high without higher price high is a divergence. The colors on the lower plot look backwards, but remember–the lower indicator is plotting a bullish divergence for the value of CCI, NOT the value of price. And as CCI rises, price generally declines.

CCI_Divergence

To make the top study, just follow the MACD divergence tutorial, but in the recursive divergence functions, change the references from MACD to CCI in this way:

input l=14; #This is the CCI input length
rec blCCI = if swinglow then reference CCI(length=l).CCI else blCCI[1];
rec brCCI = if swinghigh then reference CCI(length=l).CCI else brCCI[1];

And there you go. If you also want the lower study, you change it up a bit. The swing point checks are reversed in that you check CCI values for swing highs and lows, and then you define your bullish and bearish divergence recursive functions above to get the value of price if you are at a CCI swing high or CCI swing low, like this:

input l=14; #This is the CCI input length
def CCI=reference CCI(length=l).CCI;
Def swinghigh = if CCI > CCI[1] and CCI > CCI[2] and CCI > CCI[-1] and CCI > CCI[-2] then 1 else 0;
Def swinglow = if CCI < CCI[1] and CCI < CCI[2] and CCI < CCI[-1] and CCI < CCI[-2] then 1 else 0;
rec blPRICE = if swinglow then low else blPRICE[1];
rec brPRICE = if swinghigh then high else brPRICE[1];

Then plot what you want, and go from there! Personally, I think the lower study is less useful than the upper, but you may feel differently.

That’s it! If you are making your own, leave a comment if you have any questions. If you just want to grab mine, donate away: