Archive for the ‘Tutorials’ Category

The Complete Beginners Guide to Thinkscript

May 12, 2010

Thinkscript is the name of the code that we can use in Think or Swim charts to calculate and plot indicators. It’s a pretty simple language. If you are a code developer, then it’s no problem to pick it up by looking at some example code to figure out the syntax.

Well, some Think or Swim traders aren’t developers at all. So here’s a guide to just get a script from someone else (like me) onto your charts!

https://readtheprospectus.wordpress.com/the-complete-beginners-guide-to-using-custom-thinkscripts/

Tutorial: Creating Study Alerts and Auto-Trades in Think or Swim

October 14, 2009

In Think Desktop, it is possible to set up an alert triggered by certain indicators. It is also possible to automatically send trade orders when your alert fires. Here’s a tutorial on how to do both!

First, the bad news: As of the current time, you can only create alerts and send trades from selected built-in Think or Swim indicators. If you want to take your complicated custom study and fire alerts from it, you’re out of luck at the moment. Hopefully this will come in future releases from ToS.

To start, go to the MarketWatch –> Alerts tab in Think Desktop. Enter your ticker symbol in the field at top left, and click the “Study Alert” button (all screenshots that follow are linked to a larger, clearer version if you click them):

SA_1

The screen that comes up is your Study Alert editor:

SA_2

You’ll see several fields and options. Here’s what they do:

Trigger Type: Either “Study Value”, which uses one built-in indicator output, or “Complex Formula”, where you can calculate combinations of the built-in indicators. We’ll start with “Study Value”.

Study: Pull down list of available studies you can use.

Plot: Which output of the study to use (if there are more than one, like in the MACD indicator, that has MACD, the histogram value and the signal line)

Trigger If: Four choices here. At or Above, At or Below, Above, or Below.

Threshhold: This is the value that you are checking if your study is At or Above, Below, or whatever you chose for “Trigger If”. If the padlock is open, it will freely float until you create the alert, and if you click it closed, the value stays frozen.

Aggregation: This is the timeframe of plot that your study will be calculated against.

Parameters: Here you can change the input values of your study to whatever you want them to be.

There is also a Condition Preview plot in a lower pane, so you can see what you are specifying.

Here’s an example: Say I want to create an alert that tells me if the value of the Hull Moving Average (20) on a 5 minute chart is above a certain market price. I would choose that study from the pulldown:

SA_3

Then choose the 5min aggregation:

SA_4

The “Threshhold” value is unlocked, so it’s choosing the current floating price of the ES futures. If that’s the level you want, you’re good. If not, change it to what you want to check against, and then click “Create Alert” in the bottom right corner. Your alert is created. Since the value of that Hull MA was above the ES price when I created the alert, my alert triggers immediately, and I see the pop-up and hear a sound:

SA_5

In this example, the outcome of the study alert was compared to some constant value. This is great if you want to check if RSI(10) is above 80, for example, or if the market price reaches some level you have in mind. What if you want to check something more complex, like adding two indicators together, like $ADVN + $DECN? Then when you create your alert, you select “Complex Formula” from the “Trigger Type” dropdown:

SA_6

You’ll notice the fields have changed. Now you have a Thinkscript code window instead of the study dropdown. Here you can write code, but you’re basically limited to a single “line” of Thinkscript. Imagine that your code window has an implicit “def studyalertvalue = “, and you are just adding the rest of the code. As before, there are only some of the studies available to you (same ones as there were for the “Study Value” option). You can see them in a dropdown if you check the “Show Tools Window” box. But the real shame is that once you set up your complex formula code, you can only compare the outcome to a constant value like before. So if you want to know something like if HullMovingAvg(5) is greater than HullMovingAvg(20), then you’re stuck. But before you jump off a bridge, know that all is not lost!! You can rewrite your equation algebraically to a form that will work.

In this example, we just go from:

If HullMovingAvg(5)>HullMovingAvg(20) then…

To:

If HullMovingAvg(5)-HullMovingAvg(20)>0 then…

Those statements say exactly the same thing, mathematically. With the simple algebra, instead of comparing the two directly, we compare the difference to zero. Since zero is a constant, we can have both of our comparison variables be dynamically calculated and still work within the Think Desktop constraint. And you thought you would never use algebra after high school! 😉

So say we want to check for HMA(5) above HMA(20) on a 15 minute chart. Here’s what the example in this case would look like:

SA_7

After you set that up, click “Create Alert” as before. Once your alert is set up, you’ll get notified when the conditions trigger. You can see your alert patiently waiting in the alerts window:

SA_8

Note that each alert is a one-shot deal. Once it fires, you have to go set it up again if you want to be notified next time. Now you can stop there with alerts only, or move on to the auto-trading realm… If you dare!

***SPOOKY CATASTROPHIC LOSSES WARNING*** Before you let any computer take trades for you in a real money account, make SURE that you have tested it using a paper money account first, and that you understand what your alert code is doing!! Then read this warning again, and again.

To choose to send an order when your alert fires, you first have to create the study alert through the process above. After your alert is created, you go to the Trade tab. Then you need to create an order, but DO NOT submit it yet! Example: If I wanted my HMA study alert to send an order to go long ES, I go to the trade tab and click the ask price (step 1). A buy order is created (I could click the bid to create a sell order instead). The next step is to left-click on the “gear” icon in the order entry pane (step 2):

SA_9

After you do that, you’ll see the “Order Rules” window. Here is where you can place conditions on when your order is sent. In the top frame, you can choose whether it’s a buy or sell, the quantity, and whether it is a day order or GTC. The lower frame is where we set up the study alert trade. There are options to put in a time to submit the order, a time to cancel it, and then the paydirt: “Submit at Specified Market Condition”:

SA_10

First, click in the symbol column. The trade instrument is automatically added. Then you click in the method column, choose “Study”, and then choose the study alert you created previously (in our example it is the HMA option on top). After you choose the alert to use, then VERIFY that what you have told the computer to do is actually what you wanted the computer to do:

SA_11

Then click “OK”. The order is still sitting there, waiting to be sent. Click “Confirm and Send”, and go through the steps to enter the trade as any normal trade. Once it’s accepted, it will show in your order book as a working order, with the status “WAIT COND”:

SA_12

It will wait there until the order expires (if a day order for example), or until the alert fires. Once the alert fires, then the trade goes live and is executed according to the rules you set up. As before, once the alert trade fires, you must go set it all up again if you want to trade the next signal. The alert is held on the ToS servers, so you don’t even have to be logged in–it’s always working. However, be careful–these alerts I entered on ES actually fired in the after market and I was “filled”, so be aware of the time in force of your order or you could get filled outside of market hours, depending on what it is (options, stocks, futures, forex, etc). Make sure you test before doing anything live!

Congratulations! You are now auto-trading in Think or Swim! If this tutorial is useful to you, and you make some sweet moolah off of a trade, please consider throwing me a piece of the action:

Leave a comment if you have any questions, tips or observations!

Linking Excel and Think or Swim for Streaming Real-Time Calculations

September 6, 2009

Ever wanted to put your Think or Swim watchlists into Excel? Ever wanted to import your price quotes into Excel? How about the impossible dream–get data streaming into Excel from Think or Swim? Today is your day. First off, we should thank the folks at Think or Swim for making the interface work so well. It’s amazing to me how simply and easily it works! Usually, more complicated means more powerful, but ToS blows that paradigm out of the water with a remarkable frequency. On to the tutorial!

Importing Watch Lists to Excel and Saving the Quote Data

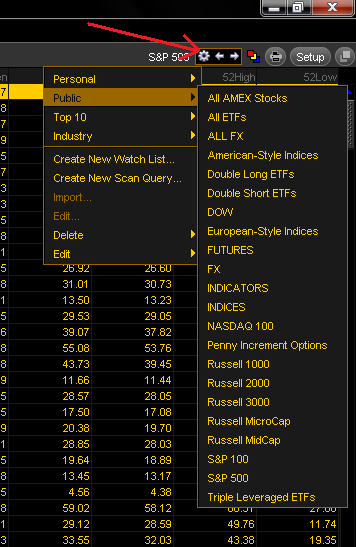
To move a watchlist from Think Desktop into Excel, go to your “MarketWatch” tab, choose “Quotes” and pull up the watchlist. You can build your own, or choose from a lot of built-in lists by clicking the “gear” icon in the upper right:

Choose_Watchlist

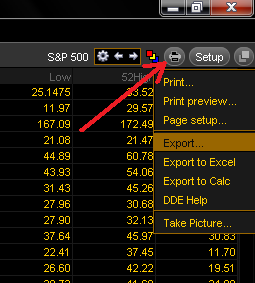
From that menu, either create a new watchlist or scan query, or choose a public list like the S&P 500. Next, click the “printer” icon, and you’ll see an option to “Export”:

Export_Menu

If you click “Export”, you can save the current list, symbols and associated data as a .csv file. Then you can open it in Excel or your favorite text editor and see your symbols and saved data values. Now, saving these watchlists is nice and all, but we want the Holy Grail: performing real time calculations in Excel on streaming data for multiple symbols at once.

Streaming Real-Time Quotes in Excel
There are actually two ways to get this working–one from Think Desktop itself, and the other from within Excel.

From Think Desktop:
To create a linked Excel file, simply go into Think Desktop to the “MarketWatch” tab, then “Quotes” like before. Choose the watchlist you want to get data for, or create a new one, same as above. Then click that “printer” icon again, and this time choose “Export to Excel” (you know, the one you wanted to click before, but you waited until now, right?). You’ll get a message that your data is ready to paste into Excel:

Paste_Notice

Now go to your Excel file (an existing one or create a new one), choose a cell and paste (ctrl+v). You will see a bunch of #N/A’s at first, then after a few seconds the streaming will kick in. Your watchlist is now in Excel and streaming data! It will keep doing so as long as Think Desktop is open and connected to Think or Swim. If you save the Excel file and close it, you can use it again later. The links will remain, but you have to open Think Desktop and connect to Think or Swim first. When the Excel file is opened, it will ask you if you want to update links from another workbook–it’s talking about the links to Think Desktop. Click “Yes” or the data won’t update. And now you know the easy Think Desktop “Export to Excel” method!

From Inside of Excel:
The data linkage to Think Desktop is done through an Excel capability called Dynamic Data Exchange (DDE). Basically, you just enter a special formula in a cell with certain arguments and Excel does the rest. This is the way you can create a linked file from outside of Think Desktop. (Think Desktop actually does the same thing when you click “Export to Excel”–it builds these formulas for you according to how your “quotes” screen is set up and puts them on the clipboard ready to paste in Excel.)

To get the last price of GOOG, you would enter this formula into a cell:

=TOS|LAST!’GOOG’

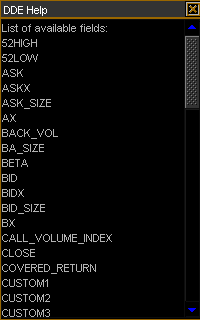
“TOS” is an identifier for the Think Desktop program that is running (which is not coincidentally named “TOS.exe”). The “|” (the pipe character) is a separator that tells Excel that “TOS” is a program to use DDE with. The “LAST” is an available data field in Think Desktop; there are 70 different fields you can use currently, which can be seen by clicking the “printer” icon and choosing “DDE Help”:

DDE_Help

Next in the formula, you put in a “!” as another separator, and then the string ‘GOOG’ tells Excel what symbol to get the data for. That’s it! As another example, to get today’s volume for AAPL, you would use the formula:

=TOS|VOLUME!’AAPL’

When you know this syntax, you can build your own quote sheet from scratch without even exporting from Think Desktop. Just type in the formula, and as long as Think Desktop is running and connected to Think or Swim servers, the link will just work. Amazingly awesome if you asked me.

So What?

You may be thinking, “So what’s the big deal? I can watch quotes from Think Desktop.” Well, here’s just a couple of examples to give you an idea of what you could do with a tool like this:

You could calculate a volume-weighted average put/call ratio for every stock in the Russell 3000 in real time.

You could show the average bid/ask spread for every stock in the S&P 500, watching the number for when average spreads widen or contract for a sense of broad market liquidity.

The possibilities are almost endless!

I’ve created a couple of Excel files that can help get you started. These files are freely available (though donations are appreciated) on my Google site, under the “Released Tools” section, in “TOS_Excel_DDE.zip”. The first file, “TOS_DDE_Examples”, has the two examples mentioned above. The second file, “TOS_DDE_Template” is a blank template sheet ready for you to enter your tickers, choose your fields from the drop downs, click “Generate” and go! In general, I’d recommend running no more symbols, fields or files than necessary to minimize processor and network overhead. Also, as in the examples file, I would separate the sheets that do the importing and the sheets that do any of your calculations.

Coming Soon: Complex Analysis for Tool (CAT) for Using Think or Swim Data in Excel

But wait!! There’s more! The tool above only shows you the most recent data values. Using some macros and other trickery we can save the historical data and calculate complex values back through time for every symbol in your watchlist all at the same time. In addition, we can use VBA and other controls to add capability for alerts, whether through a cell color change, a pop-up alert box, or even sending an email.

I’m working on I’ve released a Complex Analysis Tool (CAT) for my blog donors to do all of this. What could you do with this tool? For example:

You could watch for the highest value of RSI(10) for every stock in the S&P500 on a 5 minute bar timeframe and pop-up an alert when one breaches 90%.

You could watch for the top 5 stocks with the biggest change in volume over the last 10 minutes.

You could set an alert for every stock in the Dow, sending you an email when any stock touches its own daily pivot level.

You could calculate a real-time TICK for the S&P 500 for use with the ES futures.

The possibilities are even more almost endless!

This tool is not yet finished! But when the CAT tool is ready, I’ll make it available to blog donors only over on my Google site, in “Released Tools”, in the “Donors Only” folder. If you want to donate, just hit my Paypal link and throw me a Jackson ($20 for those from out of town). Or a Franklin, I’m not picky 😉

If you are interested in having me make a fully custom CAT tool for you according to your own specifications, send me an email for a price quote!

As always, questions are free for the do-it-yourself crowd, whether you’re trying to learn how to tweak my files for your own needs or build one of your own from scratch. Just leave a comment, I’m always glad to answer questions.

Tutorial: Formatting Plots Using Thinkscript for Think or Swim

June 4, 2009

I have had many requests in the past to change the default formatting of an indicator–color, line style, etc. This is easy to do, but not well documented. So here’s a tutorial on how to format plots in Think or Swim!

All indicators need to have at least one “plot” for them to show up on a chart. Let’s work with this example of a 20-period Exponential Moving Average:

plot myindicator=ExpAverage(close,20);

Once you have defined the plot, you can change many different parameters in this way:

myindicator.FUNCTION(arguments);

You begin with the name of the plot. “FUNCTION” is a certain function you want to use, and “arguments” are any inputs to the function. Here’s some things you can do with your Thinkscript plots:

Set the Color

To set the plot’s default color, you can use the “SetDefaultColor()” function. To set the indicator to the color white, use this:

myindicator.SetDefaultColor(Color.White);

“Color.White” is an argument that tells Thinkscript to use the color white. Very complicated, I know. 😉 Here’s a list of the different colors that are pre-defined in Thinkscript:

untitled2

(FYI, the list is found under “Color” in the “Constants” section of the Thinkscript editor sidebar.) “Color.Uptick” and “Color.Downtick” match whatever you have set for these colors in the main chart settings panel.

Change the Color According to a Value

To change the color on the fly, you use the “AssignValueColor()” function. If you want to apply conditional color formatting, you can also use an if/then/else statement, like this:

myindicator.AssignValueColor(if close>=myindicator then Color.Green else Color.Red);

In our example, this code will recolor the EMA green if the close of a bar is above the EMA, and red if the close is below the EMA.

Set the Curve Style

You can change the line style of your indicator using the “SetStyle()” function. The possible arguments are:

curve.FIRM # The standard line
curve.INEDITABLE # Standard line, but cannot be changed by user
curve.LONG_DASH # Long dashes
curve.SHORT_DASH # Short dashes
curve.POINTS # Just a dot

So if you wanted your EMA to be long dashed, use this:

myindicator.SetStyle(curve.LONG_DASH);

Set the Plot To a Histogram or a Line With Markers

The “SetStyle” command just applies to the standard curve. To use other styles, use the “SetPaintingStrategy() function. The possible arguments are:

paintingstrategy.HISTOGRAM # Plots with a bar from 0 to the value
paintingstrategy.LINE_VS_POINTS # Plots a line, but with dots at each value
paintingstrategy.LINE_VS_SQUARES # Plots a line, but with squares at each value
paintingstrategy.LINE_VS_TRIANGLES # Plots a line, but with triangles at each value

To make our EMA have a square at each point, use this code:

myindicator.SetPaintingStrategy(paintingstrategy.LINE_VS_SQUARES);

Set the Line Weight

To change the thickness of the plotted line, dot, marker or bar, use the “SetLineWeight()” function. The arguments are 1, 2, 3, 4, or 5. That’s it. The thinnest is 1 and the thickest is 5. This example sets the line to the thickest weight possible:

myindicator.SetLineWeight(5);

Dynamically Hide and Show the Plot

You can hide or show your plot programmatically with the function “SetHiding()”. The argument should be 0 for show, 1 for hide. If you wanted to show our EMA only when price was above today’s open, you could use this code:

myindicator.setHiding(if close>open(period="DAY") then 0 else 1);

Note that this will either hide or show THE ENTIRE plot based on the results of the “if” test in real time. This is what I do in my Formatted Pivot Points indicator to do dynamic hiding.

Now you know the basics of formatting your plots with Thinkscript! Leave a comment if you have any questions. For your convenience, here’s all the example plot code repeated below:

plot myindicator=ExpAverage(close,20);
myindicator.SetDefaultColor(Color.White);
myindicator.AssignValueColor(if close>=myindicator then Color.Green else Color.Red);
myindicator.SetStyle(curve.LONG_DASH);
myindicator.SetPaintingStrategy(paintingstrategy.LINE_VS_SQUARES);
myindicator.SetLineWeight(5);
myindicator.setHiding(if close>open(period="DAY") then 0 else 1);

Tutorial: Trailing Stop Strategies for Think or Swim

May 14, 2009

I have received lots of requests for making a trailing stop strategy work in Think or Swim. Unfortunately, due to the way that ToS currently works with strategies, there is no way to make your entry and exit strategies “talk” to each other automatically. But it is possible to get trailing stop strategies to work! It just takes some extra elbow grease.

In general, any intelligent trailing stop must have knowledge of the entry point, so it knows where to start trailing. You can use “dumb” stops, like my experimental “N bar trailing stop” indicator, that just takes the low / high of N bars back and plots the value. This kind of a number is always on, so to speak. But if you want to trail a certain number of points behind your entry, for example, you can’t use the “dumb” stop method. You have to know where the entry took place. So how do you do it?

The way to make trailing stop strategies work is similar to the way I made my “Volatility-based trailing stop” indicator. The key is to reproduce the entry logic in your stop strategy routine. In that indicator, I had the logic for the long side and the short side together in the same set of code. This is needed for the calculation of the new stop loss value once we switch direction. Along with this, you need to define recursive functions that perform the trailing action. In the Volatility Stop, I’m actually always calculating the values of the long side stops and the short side stops according to the ATR. There is logic to check whether that value is outside the current trailed value (ignore it) or inside the current trailed value (update the trailing stop to the tighter level). This is done for both sides at the same time. There is one more set of logic to decide if we are in the long direction or the short direction, and that tells the indicator which one to plot.

Sound complicated? Actually, it’s HARDER to make the study indicator work than it is to make the strategy work! The strategy will automatically decide if you are long or short based on the criteria you give it for entries and exits. All you have to worry about is reproducing the entry logic in your exit, and the trailing logic.

Time for an example. Say you want to trail a stop N-points below your entry price, and then move it up if “low-N” is greater than the prior trailing stop value.

(Tangent–this is different than a true trailing stop like you might have with your broker, but you have to do it this way if you want to get any backtested results out of the indicator. This is because you will get falsely stopped out if your bar range is greater than your trailing N-points value if you track from the highest high, as a true trailing stop order would. If you could plot this on the tape, tick by tick, then it would work, but for any aggregated candles you have to do it this way. Here’s an explanatory picture:

TrailStopTangent

Confusing, I know; comment if you need more explanation.)

The following strategy skeleton, when fleshed out and paired with an entry strategy, will create a simple “N-points below the low” trailing stop:

declare LONG_EXIT;
# input the number of points to trail under the entry:
input trailstop=2.0;
# Reproduce Your Entry Code Below:
#################################

def trigger=if XXXXXX then 1 else 0; # check for entry condition
def orderprice=YYYYYYY; # What price? close, low, high, etc
#################################
# Now, initialize Trailing Stop
rec ts=if trigger then orderprice-trailstop else if low-trailstop>ts[1] then low-trailstop else ts[1];
# Send LONG_EXIT order if the low touches the trailing stop (ignore the entry bar):
def stopout=if trigger then 0 else if low<=ts then 1 else 0;
addorder(stopout,ts);

The part about reproducing your entry code should be self explanatory. You put the same code in that you are using for your entry. The strategy skeleton above uses two other lines:

def trigger=if XXXXXX then 1 else 0; # check for entry condition
def orderprice=YYYYYYY; # What price? close, low, high, etc

“Tigger” is the final check for your entry condition. “Orderprice” is where you put the price that you want the trade to be taken at, or the price where you would submit the order.

Now, the part with the recursive trailing logic is trickier, and is done in two parts, like this:

# Now, initialize Trailing Stop
rec ts=if trigger then orderprice-trailstop else if low-trailstop>ts[1] then low-trailstop else ts[1];

In english: If this is the entry bar then set the trailing stop N points below the order price. If it’s not the entry bar, then check if the value of low-N points > the last trailing stop value, and if it is, then that’s the new trailing stop value, but if it’s not, then keep the old one.

Then, you check if you actually get stopped out:

# Send LONG_EXIT order if the low touches the trailing stop (ignore the entry bar):
def stopout=if trigger then 0 else if low<=ts then 1 else 0;

In english: If this is the entry bar, then do nothing. If it’s not the entry bar, then if the low of the bar hit the trailing stop (or went below) then stop out, but if not, then do nothing.

The final step is in the code that actually adds the order:

addorder(stopout,ts);

In english: Add the order if we got a stop out. Use the value of the trailing stop as the order execution price.

This acts like we had an actual stop loss order in the market, and if it was hit we’d get out of the trade. So to wrap it all up, here’s an example set of files I made using a simple EMA Crossover as the entry condition. There are two studies for visualization, and two strategies–one for the entry and one for the exit:

Download Example Files

If you add all of this to a chart, it looks something like this:

TrailingStopExample51309

Trailing Stop Strategy in Think or Swim. Q.E.D.

You could reverse all of this logic to get the short side strategies as well. Now you should know enough to make your own trailing stop strategies. Unfortunately, I can’t create a standalone trailing stop strategy that you can just drop on a chart. There has to be some editing and coding done each time that you want to use a trailing stop with different strategy of your own. Feel free to ask questions if you need a pointer or two while making your own, I’m glad to help out!

Alternatively, if you would like me to do the work for you and create a custom trailing stop strategy to go along with an entry strategy you already have, contact me and I’ll code it for you for a flat $20 donation. You can choose any trailing style you like–trail N-points, ATR/volatility-based, percentage-based, etc. I do have to ask for new donations even from past donors for this specific offering due to the additional time I have to put in for each request, rather than just giving access to the products of my brain, as it were. The $20 pricing is good if you already have the entry strategy file to send me. If you need the entry strategy developed too, then it becomes a custom development request, and I’ll have to give you a quote on the number of hours it will take in order to determine the pricing. Either way, if you need some work done, send me an email.