Ever wanted to put your Think or Swim watchlists into Excel? Ever wanted to import your price quotes into Excel? How about the impossible dream–get data streaming into Excel from Think or Swim? Today is your day. First off, we should thank the folks at Think or Swim for making the interface work so well. It’s amazing to me how simply and easily it works! Usually, more complicated means more powerful, but ToS blows that paradigm out of the water with a remarkable frequency. On to the tutorial!
Importing Watch Lists to Excel and Saving the Quote Data
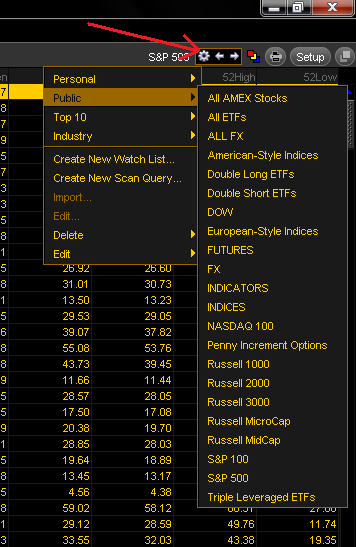
To move a watchlist from Think Desktop into Excel, go to your “MarketWatch” tab, choose “Quotes” and pull up the watchlist. You can build your own, or choose from a lot of built-in lists by clicking the “gear” icon in the upper right:

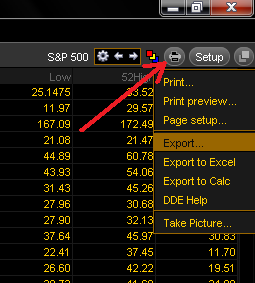
From that menu, either create a new watchlist or scan query, or choose a public list like the S&P 500. Next, click the “printer” icon, and you’ll see an option to “Export”:

If you click “Export”, you can save the current list, symbols and associated data as a .csv file. Then you can open it in Excel or your favorite text editor and see your symbols and saved data values. Now, saving these watchlists is nice and all, but we want the Holy Grail: performing real time calculations in Excel on streaming data for multiple symbols at once.
Streaming Real-Time Quotes in Excel
There are actually two ways to get this working–one from Think Desktop itself, and the other from within Excel.
From Think Desktop:
To create a linked Excel file, simply go into Think Desktop to the “MarketWatch” tab, then “Quotes” like before. Choose the watchlist you want to get data for, or create a new one, same as above. Then click that “printer” icon again, and this time choose “Export to Excel” (you know, the one you wanted to click before, but you waited until now, right?). You’ll get a message that your data is ready to paste into Excel:

Now go to your Excel file (an existing one or create a new one), choose a cell and paste (ctrl+v). You will see a bunch of #N/A’s at first, then after a few seconds the streaming will kick in. Your watchlist is now in Excel and streaming data! It will keep doing so as long as Think Desktop is open and connected to Think or Swim. If you save the Excel file and close it, you can use it again later. The links will remain, but you have to open Think Desktop and connect to Think or Swim first. When the Excel file is opened, it will ask you if you want to update links from another workbook–it’s talking about the links to Think Desktop. Click “Yes” or the data won’t update. And now you know the easy Think Desktop “Export to Excel” method!
From Inside of Excel:
The data linkage to Think Desktop is done through an Excel capability called Dynamic Data Exchange (DDE). Basically, you just enter a special formula in a cell with certain arguments and Excel does the rest. This is the way you can create a linked file from outside of Think Desktop. (Think Desktop actually does the same thing when you click “Export to Excel”–it builds these formulas for you according to how your “quotes” screen is set up and puts them on the clipboard ready to paste in Excel.)
To get the last price of GOOG, you would enter this formula into a cell:
=TOS|LAST!’GOOG’
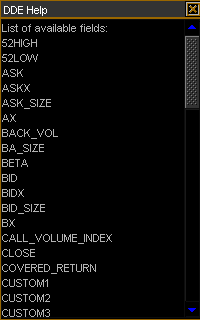
“TOS” is an identifier for the Think Desktop program that is running (which is not coincidentally named “TOS.exe”). The “|” (the pipe character) is a separator that tells Excel that “TOS” is a program to use DDE with. The “LAST” is an available data field in Think Desktop; there are 70 different fields you can use currently, which can be seen by clicking the “printer” icon and choosing “DDE Help”:

Next in the formula, you put in a “!” as another separator, and then the string ‘GOOG’ tells Excel what symbol to get the data for. That’s it! As another example, to get today’s volume for AAPL, you would use the formula:
=TOS|VOLUME!’AAPL’
When you know this syntax, you can build your own quote sheet from scratch without even exporting from Think Desktop. Just type in the formula, and as long as Think Desktop is running and connected to Think or Swim servers, the link will just work. Amazingly awesome if you asked me.
So What?
You may be thinking, “So what’s the big deal? I can watch quotes from Think Desktop.” Well, here’s just a couple of examples to give you an idea of what you could do with a tool like this:
You could calculate a volume-weighted average put/call ratio for every stock in the Russell 3000 in real time.
You could show the average bid/ask spread for every stock in the S&P 500, watching the number for when average spreads widen or contract for a sense of broad market liquidity.
The possibilities are almost endless!
I’ve created a couple of Excel files that can help get you started. These files are freely available (though donations are appreciated) on my Google site, under the “Released Tools” section, in “TOS_Excel_DDE.zip”. The first file, “TOS_DDE_Examples”, has the two examples mentioned above. The second file, “TOS_DDE_Template” is a blank template sheet ready for you to enter your tickers, choose your fields from the drop downs, click “Generate” and go! In general, I’d recommend running no more symbols, fields or files than necessary to minimize processor and network overhead. Also, as in the examples file, I would separate the sheets that do the importing and the sheets that do any of your calculations.
Coming Soon: Complex Analysis for Tool (CAT) for Using Think or Swim Data in Excel
But wait!! There’s more! The tool above only shows you the most recent data values. Using some macros and other trickery we can save the historical data and calculate complex values back through time for every symbol in your watchlist all at the same time. In addition, we can use VBA and other controls to add capability for alerts, whether through a cell color change, a pop-up alert box, or even sending an email.
I’m working on I’ve released a Complex Analysis Tool (CAT) for my blog donors to do all of this. What could you do with this tool? For example:
You could watch for the highest value of RSI(10) for every stock in the S&P500 on a 5 minute bar timeframe and pop-up an alert when one breaches 90%.
You could watch for the top 5 stocks with the biggest change in volume over the last 10 minutes.
You could set an alert for every stock in the Dow, sending you an email when any stock touches its own daily pivot level.
You could calculate a real-time TICK for the S&P 500 for use with the ES futures.
The possibilities are even more almost endless!
This tool is not yet finished! But when the CAT tool is ready, I’ll make it available to blog donors only over on my Google site, in “Released Tools”, in the “Donors Only” folder. If you want to donate, just hit my Paypal link and throw me a Jackson ($20 for those from out of town). Or a Franklin, I’m not picky 😉

If you are interested in having me make a fully custom CAT tool for you according to your own specifications, send me an email for a price quote!
As always, questions are free for the do-it-yourself crowd, whether you’re trying to learn how to tweak my files for your own needs or build one of your own from scratch. Just leave a comment, I’m always glad to answer questions.


