Archive for February, 2010

Volume Profile Goes Native to Think or Swim!

February 28, 2010

Think or Swim implemented both Volume Profile and TPO Profiles as built-in studies in the latest release. I was working on a hacked version for volume by price that was clogging up my processor, so this is a welcome addition. Here’s what the settings do:

Price Per Row Mode: Choose how it calculates how wide the volume “bin” is. You can choose “Automatic”, where it figures out a spacing on its own, or you can choose “Ticksize”, where each bin is one tick wide, or “Custom” where you can specify a width. If you choose “Custom” then the input “Custom Row Height” is used, but otherwise it is ignored.

Time Per Profile: The amount of time that each profile will include. “Chart” gives you only one profile covering the entire chart. “Hour” gives you one profile for each hour in the chart, and so forth.

Profiles: How many profiles you want displayed superimposed over the price action. If you ask for more than there are matching periods on the chart, the extras are ignored.

On Expansion: Do you want the plot over in the right hand side beyond the price action, or on top of price? “Yes” puts it over on the right hand side, with the added constraint that you only get one profile no matter how many you asked for. “No” plots each profile on top of the corresponding period’s starting bar.

On my screenshot above, I have added two “Volume Profile” studies. One is set to “Chart” and “On Expansion=yes”, so it is an overall summary of all the volume on the chart. I also added one set to “Two Days” and “On Expansion=no”. This results in multiple two-day volume distributions plotted on top of price.

Status Update

February 24, 2010

Contrary to what it may seem, I’m not dead. I’ve been sick, busier with my day job, and behind on commissioned work. So–I’m trying to get caught up on basically my entire life. Sorry for the delays and lack of postings. Hang in there if you are waiting on something. Thanks for your patience X_X

Cumulative Volume By Time Indicator for Think or Swim

February 15, 2010

This indicator is similar to the Relative Average Volume by Time script I did. Rather than comparing the current bar’s volume to the average volume for the same bar in the past, this script compares cumulative volume at each bar with what it was on past days.

To further explain, this next plot shows just the cumulated volume during each day, which is just the sum of all volume up to each bar:

My Cumulative Volume by Time indicator averages these profiles over the last N days (however many days are in your chart) and compares the current day’s cumulative volume to the average. If it is above average, the bar is yellow, and if below, it is gray. This can be useful to tell you if the current day’s volume activity is above or below average, possibly indicating if the market is active or likely to be lifeless.

This indicator is also free. Get “CumulativeVolumeByTimeSTUDY.ts” at my Google site under “Released Thinkscript Studies“. Thanks for reading, and thanks to my donors for your support!

Average Volume by Time Indicator for Think or Swim

February 11, 2010

Here’s two studies that show you how the current day’s volume bars are comparing to the same bars from the recent past. There are no inputs to these studies–they are all automatic. They only work on intraday charts. They are designed to be used for the current day only, so there is no historical record.

The time period for averaging is dependent on how you set up the chart. The minimum supported is 5 minute bars. If you put up a 5 days, 5-min chart, you’ll get the average volume for each bar over the last 4 days (ignores today). A 20 day, 15 minute chart will give the average volume of each specific 15 min bar over the last 19 days. Hopefully that makes sense; just put up as many days of data as you want averaged. (In reality, these studies are plotting average volume by bar. But if you plot them on a time-based chart, say 5-min, then you are seeing average volume by 5-min time period. Because of this, if you put it on a tick chart, the time linkage is gone. Instead, you are seeing only bar-for-bar comparisons. Just so you know.)

“AverageVolumeByTime.ts” will plot on top of the normal volume panel. It’s just the straight volume compared to the average volume seen at that bar in the past (gray shaded region). If the volume is above average, the bar is yellow, and if not it is light gray. “RelativeAverageVolumeByTime.ts” plots in a lower panel of its own, and shows the percentage of average volume for the current bar, so if all bars were at their own average volume, you’d get 100% across the board (the gray region). The bar painting is the same as for the Average Volume study.

Here’s a plot for ES yesterday, when we saw that huge volume spike come in around 11:30 ET:

In the Relative Volume study, you can see that we had a 600%(!) of normal volume bar near 12:15 ET. I remarked on twitter that this had to be a capitulation, which it was, temporarily.

These studies are free. You can download both studies in “AverageVolumeByTime.zip” from “Released Thinkscript Studies” from my Google site.

CAT Tool Plot and Update: Dollar Weighted OBV for ES

February 4, 2010

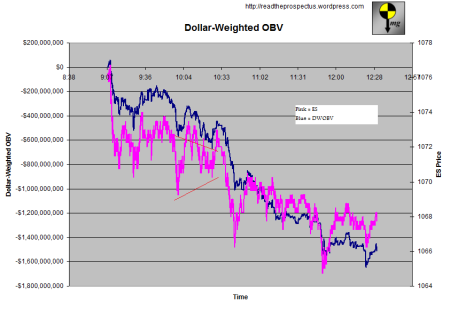
Here’s a plot of part of the day’s Dollar Weighted On Balance Volume superimposed over the price of the S&P E-mini (ES) futures. It only covers the part of the time my laptop was connected to the intertubes today, but I thought it was interesting. The Pink is the ES, the Blue is the DWOBV. There was a divergence around 10:30 AM that was followed by a big drop:

Also, I updated the dollar weighted CAT tool to record and plot the ES price (or whatever you put in your list as the first symbol), as well as added a capability to add a start time. That way you can click “Start” and it will wait to record until the time hits, or leave it blank and it will just start immediately. The update is in the “CAT_TOS_DDE_Recorder.zip” file in “Released Tools“. In the future I plan to do a bit of a re-do of the tool to make it more generic, so keep your eyes peeled for that.