Posts Tagged ‘opening_range’

S&P 500 E-mini Futures (ES) Trade: 8-24-09

August 24, 2009

I took this trade on a break of the opening range this morning. The chart shows an indicator I’m working on, called Adaptive Opening Range. Instead of defining the OR as a specific time, it defines the OR as the first swing high and swing low after the start time (0930 ET in this case). The red cloud starts when the start time (say, the market open) is reached, and the green cloud starts once the OR has been defined by a swing up and a swing down. My idea is then to trade a breakout of that OR, in whichever direction it comes. To me, this is better than a time-based OR definition because you actually get a range based on price action.

So today I went long (yellow line) on the Adaptive OR high +1 tick, stop was the OR low. I wanted 2 points on the trade (green line), but only got about 1.5 before it reversed. I eventually lowered my limit to +0.5 points and got filled (red line). Then price went on up well past my target. Again!

ES Trade 8-24-09

I’m too loss-averse and I end up scratching these OR trades before they have a chance to work. That or I need to reign in my target to about a point. Once I get to enough margin to trade two contracts, I’ll sell one at a closer target (like 1 point) and hold on to the other.

As for the Adaptive OR, once I get some bugs ironed out, I’ll do the usual ready-made indicator for donors, tutorial for the DIY’ers. It’s actually not too complicated once you have some logic for the swing points in place. Stay tuned…

Two Trades Today in S&P E-mini Futures (ES)

August 19, 2009

According to my developing trading setup, I should trade in the direction of the very early Opening Range (OR) breakout. Today, I watched a 1 min OR and later a 5 min OR. Because of the deteriorating internals (the NYSE ADVN-DECN and the NYSE Tick), as well as my net -0.5 point loss yesterday, I hesitated and passed on the trade, but it would have been a winner. Mistake #1. Then I went short as I thought I saw a topping near S1, but was wrong right away. Instead of cutting it early at about a -1 point loss, I held on until the full -2 points (my stop) to see if it would go my way. The trade gave me a lot of time to get out gracefully, but I just kept sitting to see if it would salvage itself. Mistake #2. Finally, I saw the writing on the wall and went long on a pullback to try to scratch the day. We got a lot of momentum near my two point target, so I pulled the limit order up two ticks and got filled, +2.5 points. Finished net +0.5 points before commissions, only about one tick after comms. Here’s the chart:

2009-08-19-TOS_CHARTS

Today’s lessons for me:

1. Don’t hesitate.
2. Be wrong faster.
3. Keep swinging if you are in good mental and emotional control, and the market environment is not adverse to it.

Back to the day job grind!

UPDATE 5:00 ET–I scalped 4 more times at the end of the day. I ended up grinding back down to -0.25 points, but adding the commissions in as well, I was down -0.75 points overall. I keep learning this lesson, over and over–scalping is for market makers and suckers. I’m in the latter camp today. With that, I’m reconsidering my options for trading education and mentoring, since I keep going in circles on my own. I’ll post about what I do.

Shaded Opening Range Indicator for Think or Swim

June 9, 2009

There is a function in Think Desktop called “AddCloud()”. This function shades the space between two plots. Assuming that you have previously defined two plots, plotA and plotB, here’s how you would use it:

AddCloud(plotA, plotB);

That’s it! The area between the two plots will be shaded–green if plotA is above plotB, and red if plotB is above plotA.

There are a lot of uses for this, but here’s one I threw together–a shaded opening range indicator:

Shaded OR

You input the market open time, and the time that you want the opening range (OR) to finish. As time progresses through the OR, the peak high and low are constantly updated and revised backward, thanks to the declare fullrange; operator. With this indicator, you get a red shaded area when the OR is active, and it turns green once the OR is completed.

You can download the “OR_Shaded” indicator from my google site in the Thinkscript Studies section. This one is free. Thanks to all my readers, donors, and customers! Your support is appreciated. Comment if you have any thoughts or questions.

Automatic Opening Range and Fibonacci Levels for Think or Swim

February 9, 2009

UPDATE 4 May 2009: Modified code so user can specify the open time. This is useful for trading the OR in other markets such as the Globex futures session.

UPDATE 11 Feb 2009: Added second fib extension option per Jim’s comment.

trader-x-or-fibs

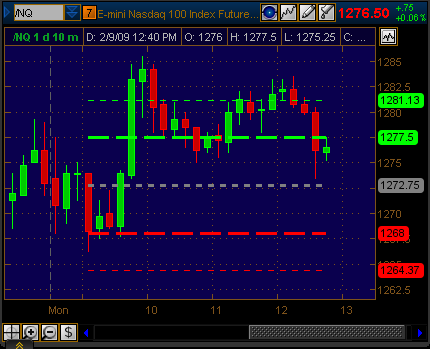
Trader-X has returned to blogging recently (and there was much rejoicing)! He is sharing his new, simplified setups on his blog. I decided to do some Thinkscript code to automate the plotting of the opening range and the Fibonacci retracements and extensions that Trader-X now uses. This is all my own interpretation of what X is doing, so any errors are my own.

I decided that the plot behavior I would want is to plot these lines starting from when the OR is defined, showing nothing at any time earlier than that. This helps to visually cue you to NOT take a trade before the OR is completed! If you want to see the levels for each day, set the input “ShowTodayOnly” to “No”. You also input the time (EST) that the OR begins, and the time the OR is “completed”. If your market opened at 9:30 EST, and you wanted a 30 minute opening range, you would enter “0930” for ORBegin, and “1000” for OREnd (and that is the default). A 60 minute OR would be “0930” and “1030”, respectively. Finally, you can input the fib extension you want plotted as well.

Here is the code: (more…)