Hello, it’s been a long time. Life finds a way to get you off track. I’m trying to get things here up and running again.
This is something I was working on a long time ago, and I just re-visited it this last week. I think it’s interesting, so here it is: ProSwingVWAP.
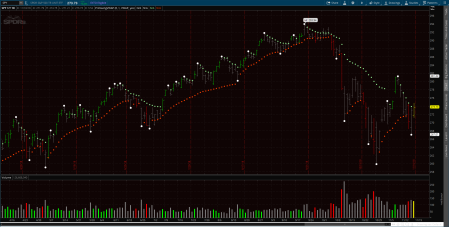
A VWAP is a volume-weighted average price. I talked about VWAPs more here. The idea for this indicator is to use Swing Points to define the period where we start tracking the volume-weighted value. The chart above shows it in action. I like using a VWAP as the price input, so you get a running volume-weighted total of each bar’s VWAP. Kind of a VWAP squared. You can use close, high, low, etc. as well.
Once a swing point (white dot) is charted, that swing point becomes the first value for that SwingVWAP. From there, the price value you choose to average for the VWAP is volume-weighted on each bar and the running VWAP is adjusted. This is done for swing highs (green dots) and swing lows (red dots) separately. As long as a new swing high / low hasn’t been made, that long / short VWAP value will just continue to build. A new swing high or low will reset the VWAP and start again. I added optional paintbars to show green when a bar close is above the swing high VWAP, red if a bar closes below the swing low VWAP, and grey if it closes between them. I also hide the VWAP value if bars close beyond them.
Because swing points need to have some future values to know if it really is a swing, there is a delay in this indicator. The more forward bars you require to decide if a swing is in, the longer it will take for the data structure to be confirmed. If you set the “FlagEarly” input to yes, then paintbars are yellow during this unknown stage. The fastest reaction is if you use a value of 1 for Swing Forward, but you get more false positives this way too. I usually use a value of 1 or 2. The more bars back you look (Swing Back), you get fewer swings but they are bigger ones. I mess with this value based on the timeframe and the particular name I’m working with, but I’ll usually use 8 or so.
I’m still in the research phase of this one, so I haven’t decided exactly what to do with it yet. I like how it defines trends. A bull trend is present when price is closing above the long SwingVWAP, and a bear trend when price is closing below the short SwingVWAP. I also like the way it shows when a pullback is on, and when the trend resumes. On the chart above of $SPY, the period from June to October is a prime example. The market bottomed out at the end of July and then started an uptrend. When a new swing high was in, the long SwingVWAP (green dots) told us when we were still in the pullback. Once price closed above the long value again, the trend was back on. The short SwingVWAP kept trailing along below, reminding us that we were in a bull trend. Then, as October started, we closed below the short SwingVWAP very dramatically, and the correction was on. Now we seem to be right back in the middle of the two in a holding pattern.
For now it’s a just a context indicator rather than a trading signal, but it looks like it has some potential. You can get ProSwingVWAP in the “Donors Only” folder in “Released Thinkscript Studies” at my Google site. It will work on desktop or mobile, but paintbars only work on the desktop platform.
If you’d like to become a blog donor, hit the button below:


A Look At a Few Charts: Revisited
September 3, 2019As a follow-up to the charts I posted before my annual August hiatus, here’s what happened for each of those names. The yellow line in each of these charts is July 17, when I posted the charts before.
SPY:
The broad market ended up having a big drop as August started, but mostly recovered since then. If you tried to trade breakouts you got chopped to pieces. If you tried to fade breakouts you had to take a lot of heat during the chop for not a lot of benefit. This chart is textbook for how I used to give away a lot of my gains for the year by forcing trades during this time. I’m happy I sat this out. Things seem bleak for the markets going forward with global slowdowns and recession indicators flashing. I’m leaning toward taking more defensive long term positions here.
AAPL:
Earnings were good, AAPL spiked and then sold off all the gains. Then it dropped, and shorts got burned in that chop. In the end, it’s at the same level today as it was when I posted the chart before. Nothing but pain in August.
ROKU:
ROKU was the exception to my August rules. After some contraction before earnings, it popped and didn’t look back. If I weren’t sidelined by rule, I would have gone long on the Swing VWAP breakout at about $135. I have liked ROKU all year and in this case, breaking my rule would have paid off. Missing things like this and accepting it are important to having the right trading mindset. There have been so many good setups in ROKU this year, and I’ve been able to catch a few of them. It’s ok if I don’t get every one. Greed is a killer, as is fear of missing out, and begrudging any moves you may have missed.
TSLA:
TSLA ended up being pretty volatile with the earnings report and different news stories during August. Any of my typical setups would have lit me on fire. Lots of chop, lots of heat whether you traded breakouts or faded them. The only edge was in knowing the news and earnings beforehand, which is basically impossible unless you are cheating with inside info. Another good chart to watch rather than trade.
Going into the fall, I’ll keep an eye on any setups that may occur. I’m biased toward the bearish side, but we’ll see how things pan out.
Tags:AAPL, chop, market_environment, Psychology, ROKU, SPY, swing_points, Thinkscript, trend, TSLA, vwap
Posted in Market Commentary, Psychology, Thinkscript, Trading System Development | 2 Comments »