The latest update broke the ability to hide clouds automatically. So I fixed it in the CumTickv2 study. The version on my Google site is the most recent one. Go download again if you want it.
Posts Tagged ‘cumulative tick’
CumTick Study Updated
November 17, 2010Cumulative Tick Study (v2) for Think or Swim
October 25, 2010Here’s the v2 for my cumulative tick study. See the prior post for the full explanation of what it is doing and why.
Changes:
I include the trend correction automatically. I took the paintbars out. The “ema” input is now called “smooth” for clarification.
New inputs:
“Filter”–for the high and low bands, you can filter on a minimum tick level such that the bands don’t overweight small adverse tick values after a pronouced move. Basically, if you think +-300 on the NYSE tick is “noise”, then enter 300.
“Symbol”–you can use any symbol you want: $TICK, $TICKQ, $TIKI or anything else.
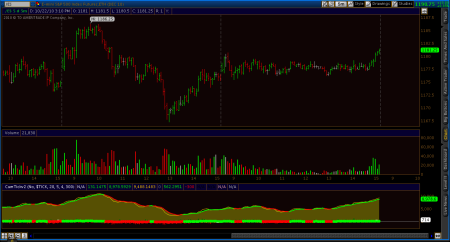
You can also hide the cumulative tick plot or show it. If you show it, you get a plot that looks like this:
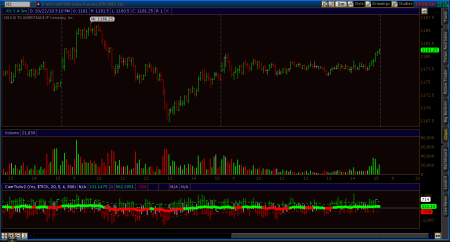
If you hide it (default) then you get a chart like this, where you can see the detail of each tick reading:
The color of the dots shows you the color of the cumulative tick, just the same as if you were showing the cumtick plot. Usually, we don’t care about the absolute value anyway, just the trend of it, so this is default. The values of the dots are the values of the trend correction that is being added into the cumulative tick number. Confusing? I hope not, but leave a comment if so.
I did some cleanup to the indicator, so the tick bars now plot the actual high and low values like a regular price-based bar, not just a flat out histogram from 0 to the value. Basically, you’ll see some black gaps if the low of the tick was positive, or the high of the tick was negative. Just aesthetics. If your chart background is not black, then change the colors of the “hib” and “lob” plots to match your background.
Finally, there is a little white dash on the most recent bar showing the “last” value of the tick, so you can see in real time where its printing. After the fact it just shows the closing value at the last bar of the day.
This version is free. Download “CumTickv2STUDY.ts” from my Google site under “Released Thinkscript Studies“.
Cumulative Tick Chart for 5-19-2010
May 19, 2010Here’s the 5 min ES chart showing today on the far right. The cumulative tick did well in the morning for identifying direction, but got killed in the late afternoon sideways trade, as I suspected it would in chop (and pointed out at the time on Twitter):
Really, the holy grail is correctly calling a range bound market vs. a trending market IN REAL TIME. Anyone can call it after the fact, of course. More ideas to come…
Cumulative Tick Chart for 5-17-2010
May 17, 2010Look at this 5-min chart for the last two days in ES. It has my cumulative tick indicator on it, which is continuing to impress me in how it picks the right direction in the markets. It’s using a paintbar to color-match with the indicator line in the lower panel:
And that’s a free indicator! I’m thinking (in what very little spare time I have) about entry and exit rules for this so I can program it into a strategy. It probably is death in a choppy market no matter what rules you use. Feel free to leave a comment if you have any suggestions.


